Turning Volatility into Opportunity
This strategy is the brainchild of my business partner, Brock Rogerson, whose trading expertise far exceeds mine. Together, we’ve worked to refine it, transforming market volatility into opportunity and making time our ally.
Introduction
Ever wondered how to turn market fear into a lucrative investment opportunity? That’s exactly what we’ve been doing by investing in SVXY call options when the VIX Index soars above $25.
Let’s dive into how we’ve managed to profit from market volatility, using real-world scenarios, past events, and even drawing parallels with significant financial events.
Understanding SVXY and the VIX
The VIX Index
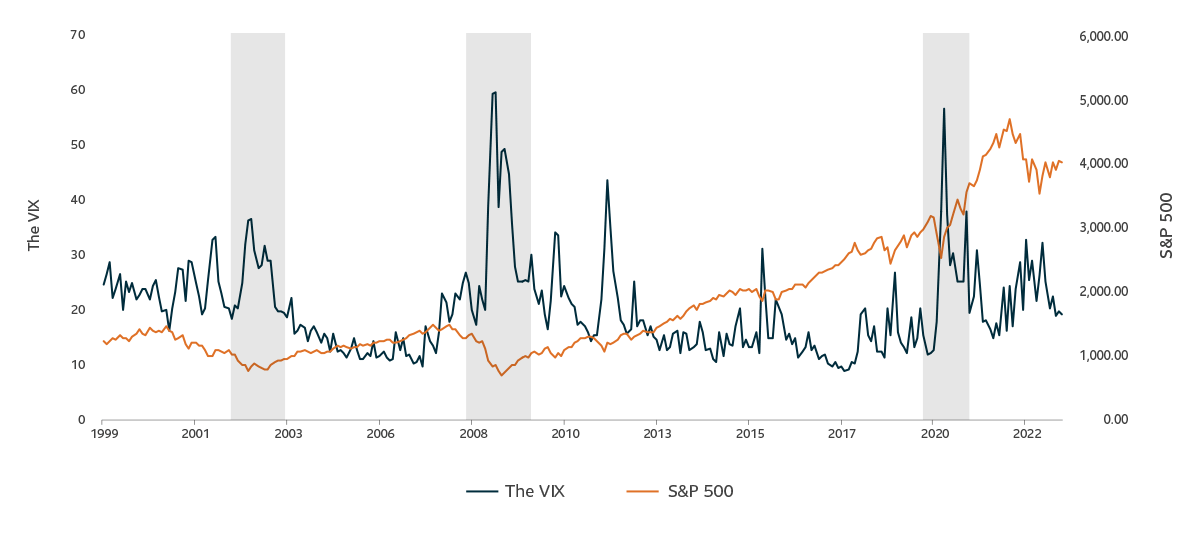
The VIX (CBOE Volatility Index) measures the stock market’s expected volatility over the next 30 days using a portfolio of options on the S&P 500. It’s often called the “fear gauge” because it reflects how uncertain or nervous investors are about the market.
Simple Explanation: The VIX goes up when people expect big swings in stock prices (usually during bad news or crises). It goes down when the market feels calm and stable.
Key Point: It doesn’t measure actual market movement but rather what people expect will happen based on options pricing.
In short, the VIX tells you how “scared” or “relaxed” the market is feeling about the near future.
The SVXY (ProShares Short VIX Short-Term Futures ETF)
The SVXY (ProShares Short VIX Short-Term Futures ETF) a financial product designed to move in the opposite direction of the VIX (a measure of stock market volatility).
Simple Explanation: When the VIX (fear in the market) goes down, the SVXY usually goes up, but at half the speed (because it provides -0.5x exposure). It’s like betting on things calming down after a period of market panic.
Key Point: It doesn’t track the VIX directly; it follows an index tied to VIX futures, so it focuses on the expected future volatility rather than today’s volatility.
In short, SVXY is used by traders to profit when they believe market fear will decrease and stability will return.
Inverse VIX ETFs are used mainly by sophisticated traders as part of a broader portfolio involving other highly technical trades. It is important to note that these are highly complex instruments with unique risks. They are intended for investors with very short-term time horizons and should not be used as part of a buy-and-hold strategy. Investors would be wise to carefully consider their own risk tolerance and risk capacity before considering whether to trade such securities.

Summary: The inverse relationship between the VIX and SVXY is the cornerstone of our strategy. When the market settles after a bout of panic, the VIX decreases📉, and SVXY increases📈
The Rationale Behind The Strategy
Why invest in SVXY when the VIX spikes above $25? Here’s the reasoning:
- Mean Reversion of Volatility: Historically, the VIX doesn’t stay elevated forever. It typically reverts to its average levels, making spikes often temporary (the market regains confidence.)
- Overreaction to Market Events: Sudden jumps in the VIX usually reflect short-term fears. As situations clarify, the VIX often declines.
- Leverage Through Options: By purchasing call options on SVXY, we can control a larger number of shares with less capital, amplifying potential returns, but with greater risk.
Scenario Modeling with $100,000 Investment
To understand this strategy, let’s simulate hypothetical scenarios.
Assumptions
- Investment Amount: $100,000
- Option Type: In-the-Money (ITM) SVXY call options
- Time Frame: Options expire in 30 days
Scenario 1: Moderate VIX Spike and Reversion
- Day 0: VIX spikes to 30, SVXY drops to $40. Buy ITM call options at $5/share.
- Day 30: VIX reverts to 20, SVXY increases to $50.
Profit Calculation:
- Contracts Purchased: 200
- Total Option Value: $200,000
- Net Profit: $100,000 (100% ROI)
Scenario 2: Extended Volatility
- Day 0: VIX spikes to 35, SVXY drops to $35. Buy ITM call options at $7/share.
- Day 30: VIX remains elevated, SVXY slightly increases to $38.
Profit Calculation:
- Contracts Purchased: 142
- Total Option Value: $42,600
- Net Loss: -$57,400 (-57.4% ROI)
Scenario 3: Rapid Volatility Decline
- Day 0: VIX spikes to 28, SVXY drops to $42. Buy ITM call options at $6/share.
- Day 15: VIX drops sharply to 18, SVXY increases to $55.
Profit Calculation:
- Contracts Purchased: 166
- Total Option Value: $215,800
- Net Profit: $115,800 (115.8% ROI)
Reviewing the Strategy Timeframes on Previous Events
Quick Reversals (within days to a few weeks):
COVID-19 Recovery (March-April 2020)
- Event: Initial panic over COVID-19 caused the VIX to spike above $80 in March 2020.
- Reversal: Once central banks implemented aggressive monetary easing and fiscal stimulus measures, the VIX began declining rapidly from its highs.
- Timeframe: The VIX moved below $25 in about two months, but the steepest part of the decline occurred within three weeks of the peak.
Brexit Referendum (June 2016)
- Event: The unexpected result of the Brexit vote caused the VIX to spike above $25 temporarily.
- Reversal: The VIX declined quickly as markets absorbed the news and reassessed the long-term impact.
- Timeframe: The reversal took about 7-10 trading days.
U.S. Debt Ceiling Crisis (August 2011)
- Event: Concerns over a U.S. credit downgrade caused a VIX spike to around 48.
- Reversal: The VIX began retreating after political resolution and market stabilization.
- Timeframe: The decline to below $25 took about a month.
Prolonged Elevated Periods (months to years):
2008 Financial Crisis
- Event: The VIX spiked above $25 in September 2008 during the Lehman Brothers collapse and stayed elevated as the financial system remained under severe stress.
- Prolonged Period: The VIX stayed above $25 for several months, peaking at 89 in October 2008 and only declining consistently in early 2009.
- Timeframe: Over six months above $25.
Dot-com Bubble (2000-2002)
- Event: Market volatility surged during the tech sector crash, with multiple VIX spikes above $25.
- Prolonged Period: Volatility remained elevated due to economic uncertainty and corporate scandals (e.g., Enron).
- Timeframe: Spent much of 2000-2002 above $25, with intermittent declines.
COVID-19 (2020)
- Event: While the sharpest part of the decline in the VIX was quick (as mentioned above), the VIX remained above $25 for much of 2020 due to persistent market uncertainty.
- Timeframe: Roughly nine months above $25 before consistently falling.
Typical Timeframes for VIX Normalization:
- Quick Reversals: 7-30 days after the resolution of the immediate event.
- Prolonged Periods: Months to over a year, particularly during sustained economic crises or systemic issues.
Key Factors Influencing Timeframes:
- Nature of the Crisis:
- Event-specific shocks (e.g., geopolitical tension, election outcomes) often resolve faster.
- Systemic issues (e.g., financial crises) take longer to stabilize.
- Policy Response:
- Swift central bank or government interventions tend to shorten elevated VIX periods.
- Market Sentiment:
- Extreme fear or uncertainty can prolong elevated volatility, even if underlying issues are addressed.
Determining When to Place the Trade
Timing is crucial. Here’s how to execute the trade:
Indicators to Consider
Technical Indicators
- VIX Mean Reversion Signals: Is the VIX likely to revert to its average?
- Bollinger Bands & RSI: Overbought conditions can signal a coming decline.
- Candlestick Patterns: Bearish reversal patterns on VIX charts.
Sentiment Indicators
- Put/Call Ratios: High ratios may indicate excessive bearishness.
- Market Breadth Indicators: More advancing stocks can signal improving sentiment.
Macro-Economic Indicators
- Economic Data Releases: Events reducing uncertainty can decrease the VIX.
- Central Bank Announcements: Policy clarity can calm markets.
News and Events
- Resolution of Geopolitical Events: Conclusions of major events often reduce volatility.
- Earnings Seasons: Positive surprises can improve market sentiment.
Correlation with Other Assets
- Equity Market Trends: Stabilizing indices like the S&P 500.
- Commodity Prices: Falling gold prices may indicate reduced fear.
Choosing the Right Option Expiry
The expiry date is critical due to time decay (theta):
Short-Term Options (1-2 Weeks)
- Pros: Lower cost. High Return Potential.
- Cons: Less time for the trade to work out. Higher Risk.
Mid-Term Options (1-2 Months)
- Pros: Balance between time decay and time for the expected move.
- Cons: Higher premiums than short-term options.
Long-Term Options (3+ Months)
- Pros: More time for the trade to develop. Lower Risk.
- Cons: Higher cost and slower percentage gains.
My Preference: I typically opt for long-term options to allow for the VIX to revert to its average levels. Sacrificing upside, but buying myself time incase the market doesn’t react as expected.
What’s the Return Potential?
Highest Return Potential
- Theoretical Maximum Return: Unlimited, as SVXY can continue to increase.
- Practical Considerations: SVXY’s movements are influenced by market conditions and its inverse relationship with the VIX.
Example Scenario:
- Initial Investment: $100,000 in SVXY call options when VIX is at 40.
- Outcome: VIX drops to 10, SVXY climbs significantly.
- Net Profit: Could be upwards of $540,000.
- Percentage Return: 540%.
Note: Such dramatic movements are rare and usually occur during rapid market recoveries.
Expected Return Range When Successful
When the trade unfolds as planned, a reasonable expectation is:
- Conservative Scenario: 50% to 100% gain.
- Moderate Scenario: 100% to 200% gain.
- Optimistic Scenario: 200% to 300% gain.
My Personal Approach
I aim to be conservative to resist the urge for greater risk. Setting expectations at a maximum of 100% ROI, but suggests considering selling around the 60% mark unless you have extremely strong conviction. Achieving a 60% return once a year—or even every other year—is more than enough for me.
- Example: With a $200,000 allocation, my expected profit is $120,000 in a matter of weeks. Not a bad pay day if you can pull it off every other year.
Risk Management Tip: Treat this as an all-or-nothing trade. Extreme risk tolerance is required. I recommend using no more than 5% of your portfolio for this strategy due to the potential for total loss if timed incorrectly. Start with a paper trade to get a feel for the strategy.
Over the past 35 years, the VIX has crossed above $25 a total of 44 times, averaging about 1.25 events per year. This count only includes cases where the VIX first rose above $25 and then dropped below it on a prior trading day before spiking again. This distinction is key because once the VIX is elevated, it can remain high for weeks or even months.
I use $25 as the threshold because it indicates a level of market volatility (fear and panic) where I feel confident the potential payout is worthwhile. Typically, there’s a legitimate reason for such a spike. However, we know the market always reverts to the mean and recovers over time. The real challenge for a trader is predicting the timing based on all the available information at that moment.
Final Thoughts
Investing in SVXY call options when the VIX Index exceeds 25 is an exciting strategy that bets on the natural calming of the markets after a period of uncertainty. While the potential upside is significant due to leverage and the inverse relationship between SVXY and the VIX, it’s not without risk.
- High Reward Comes with High Risk: There’s potential for total loss if the VIX doesn’t decline as expected.
- Timing Is Crucial: Aligning technical, sentiment, and macroeconomic indicators increases the probability of success.
- Risk Management Is Essential: Careful position sizing and continuous monitoring are vital.
To simplify, this strategy is a bet on the time it takes for the market to calm down after a period of fear; the timing is everything. If I feel the market will calm down quickly, I will be more aggressive, buying less time with shortening the expiry of the call options, and vice versa.
Disclaimer: This information is for entertainment purposes only and should not be considered financial advice. Trading options and volatility-linked ETFs involves significant risk. Always consult with a qualified financial advisor before making investment decisions.